If you're a web developer, then you surely spend quite some time poking around in browsers dev tools or web console. Inspecting elements, modifying CSS or running commands in console - these are some basic things that every web developer knows how to do using browsers developer tools. There are however, quite a few more things you can do inside your browser to make your debugging, development and web design so much more efficient. Here are a few hidden or lesser known features of Chrome DevTools which you should know about and which you will be using every day...
Pretty-Print Array as Table
When working with lots of data in JavaScript (e.g. creating data visualizations), things never work on first try and you will inevitably have to go to web console and view the data - probably with console.log. That will yield JavaScript Object (JSON), which in case of 2D arrays is going to be hard read and hard to find useful information in. But there's simple fix for that:

All it takes is to replace console.log with console.table. This function can easily display 1D and 2D arrays, but what makes this function extra useful is that it can also correctly displays column names and on top of that it also allows you to sort by each of these columns. So, to get table like the one above you would use data in following format:
[
  { "country": "Austria", "percentage": 11.6429, "year": 2012},
  { "country": "Belgium", "percentage": 8.5718, "year": 2012},
  { "country": "Czechia", "percentage": 3.1569, "year": 2012},
  { "country": "Denmark", "percentage": 13.0096, "year": 2012},
  { "country": "Estonia", "percentage": 8.3903, "year": 2012},
  { "country": "Finland", "percentage": 23.3728, "year": 2012},
  { "country": "France", "percentage": 10.1641, "year": 2012},
  { "country": "Germany", "percentage": 7.4749, "year": 2012},
  { "country": "Greece", "percentage": 9.2186, "year": 2012},
  { "country": "Hungary", "percentage": 10.4749, "year": 2012},
  { "country": "Iceland", "percentage": 13.9053, "year": 2012}
]
Using Multi Cursor
One of the most basic features and shortcuts in every code editor is multi cursor and multi select. If you're trying to be as efficient as possible like me, then you will surely put these shortcuts to good use:
Multi Cursor using CTRL + Click:
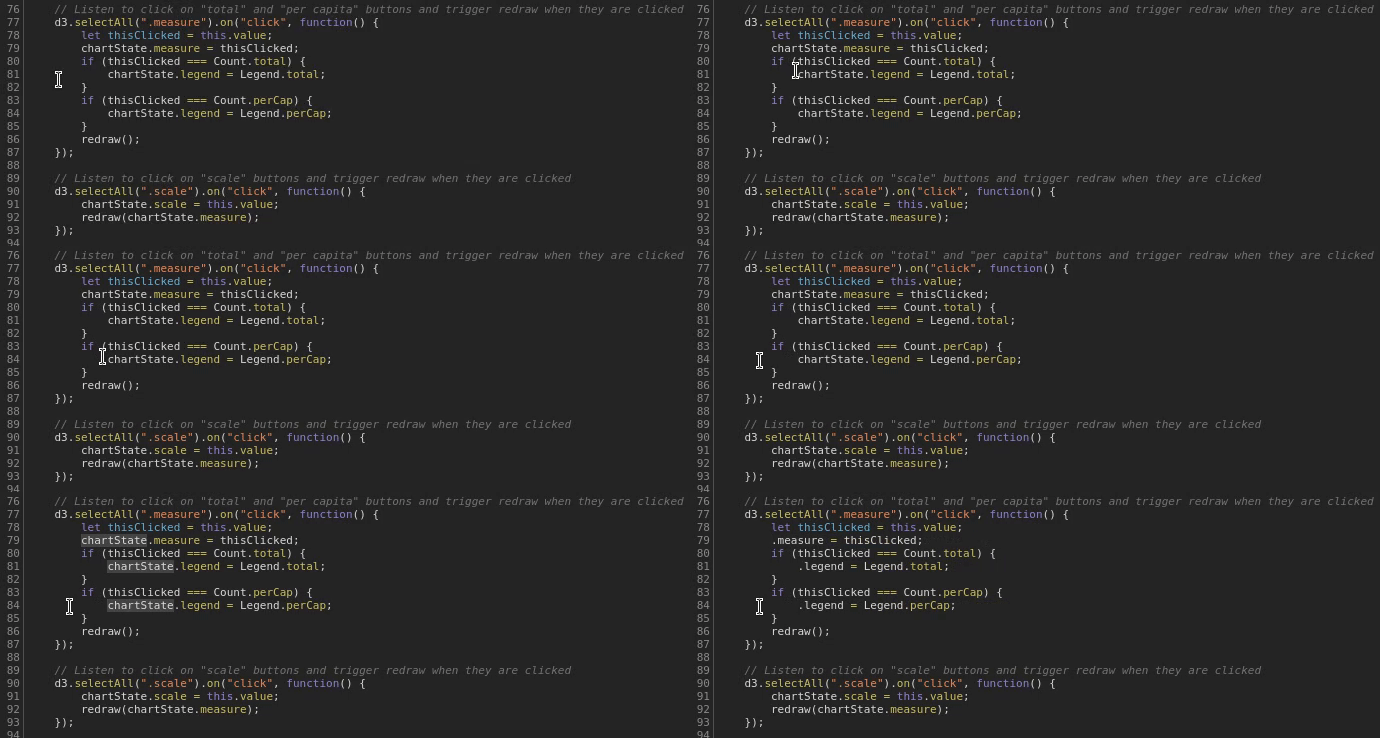
Multi cursor is helpful, but not very accurate and little cumbersome when you need to select and replace a lot of occurrences of a text. For those cases you can use much more suitable CTRL + D shortcut:
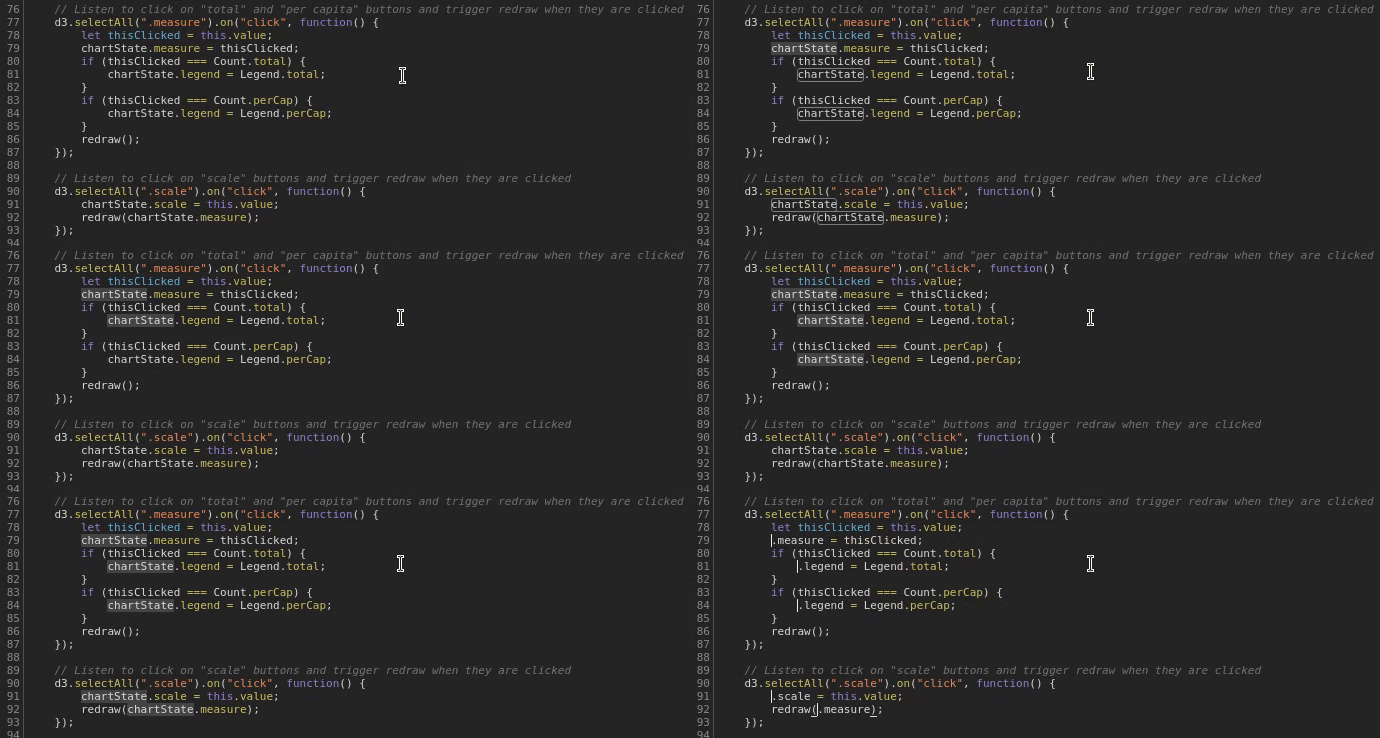
In the GIF above you can see how one could use CTRL + D to select (and optionally CTRL + U to deselect) occurrences of text to easily modify them or replace them.
Using Command Palette
There's a lot of tools, tabs, files, commands, etc. in Chrome DevTools and remembering name or place where to find each and everyone of them might not be feasible. To help with that, you can use Command Palette which can be opened using CTRL + Shift + P. In this palette you will find all the shortcuts, panels, console settings, tabs, settings and more.
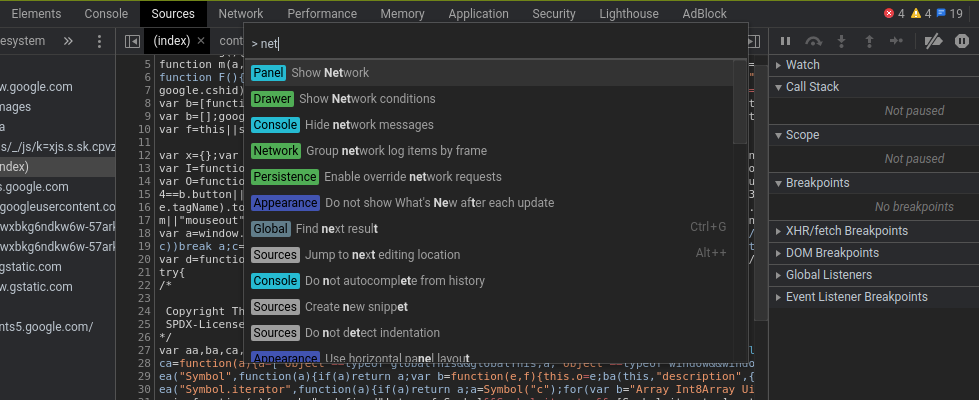
Also if you omit the Shift in this shortcut and instead use CTRL + P, it will give you list of all the available files which you can open. This can be also handy if your website has lots of source files.
Convenient Color Picker
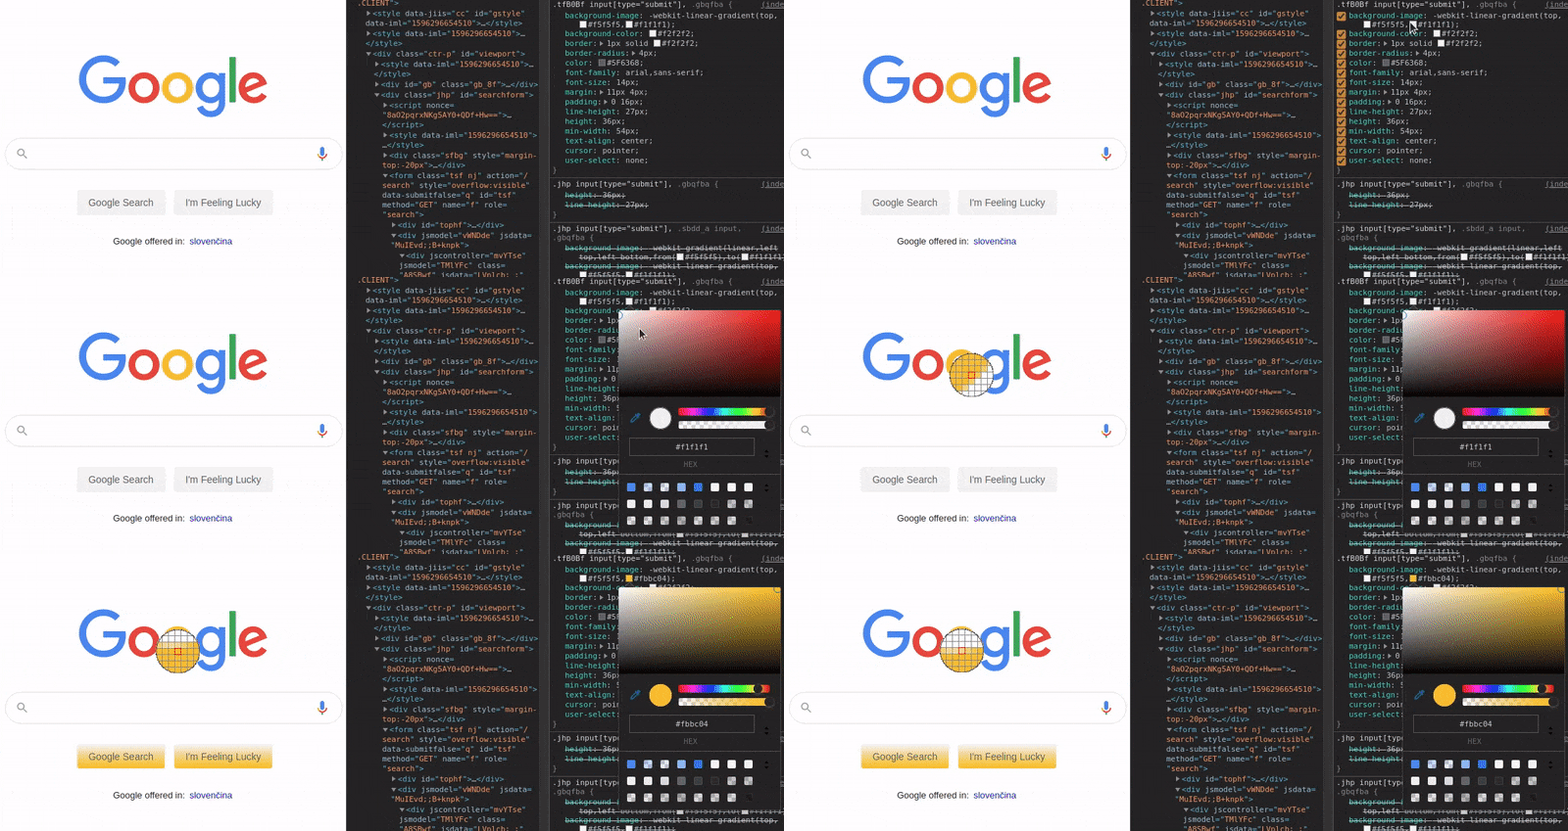
I'm probably not the only one who endlessly messes with and tweaks fonts, colors and whatnot in CSS. To make at least the color tweaking a little easier, you might want use the Color Picker which you can open by finding element which color you want to change and clicking on it's CSS color field.
This is a nice feature, but the real game changer is the ability to select any color from website just by clicking on it while Color Picker is opened - like so:
Dark Mode
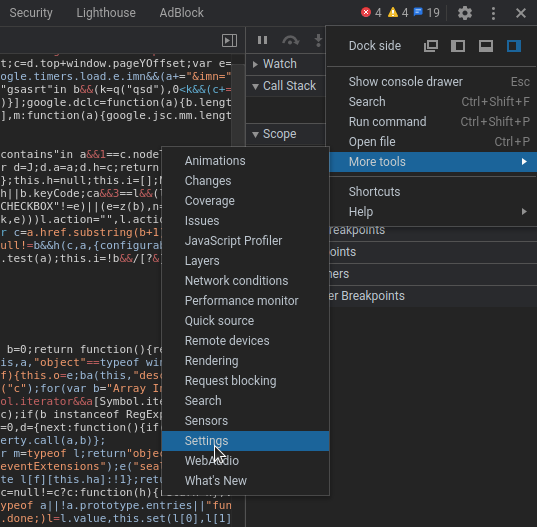
From the screenshots and GIFs above, you probably already noticed that I'm using dark mode in Chrome DevTools. So, in case you're wondering how to change from light mode to dark mode, then you can navigate to top right corner of DevTools - click on the 3 Vertical Dots icon, next select More tools and then Settings. In the settings menu select Preferences and finally set Theme to Dark. That's it! Welcome to the dark side!
Find Where CSS Property is Defined
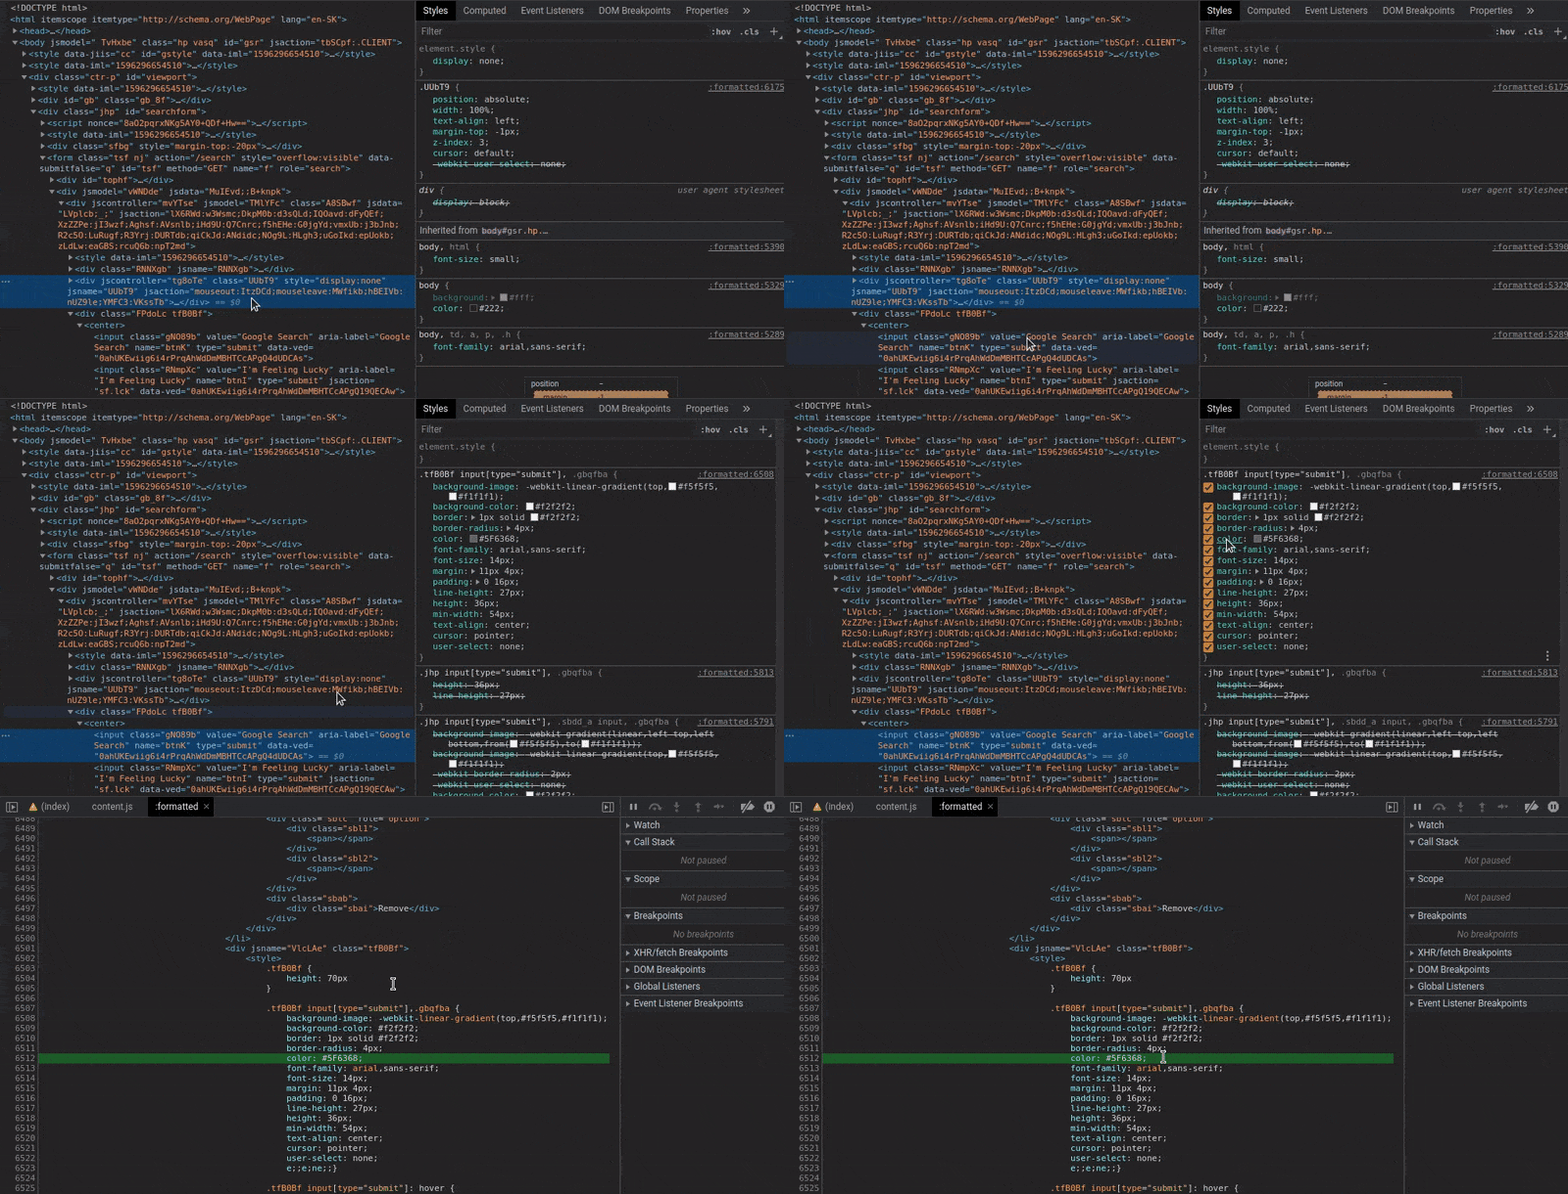
Working with CSS involves a lot of trial and error (at least for me, anyway) and rather than going between editing code in IDE and refreshing browser tab, why not save some time and do it all in DevTools? One such time-saving trick is to use CTRL + Click to find where the CSS property is defined, so that you can edit it in its source file:
Make Website Editable With Design Mode
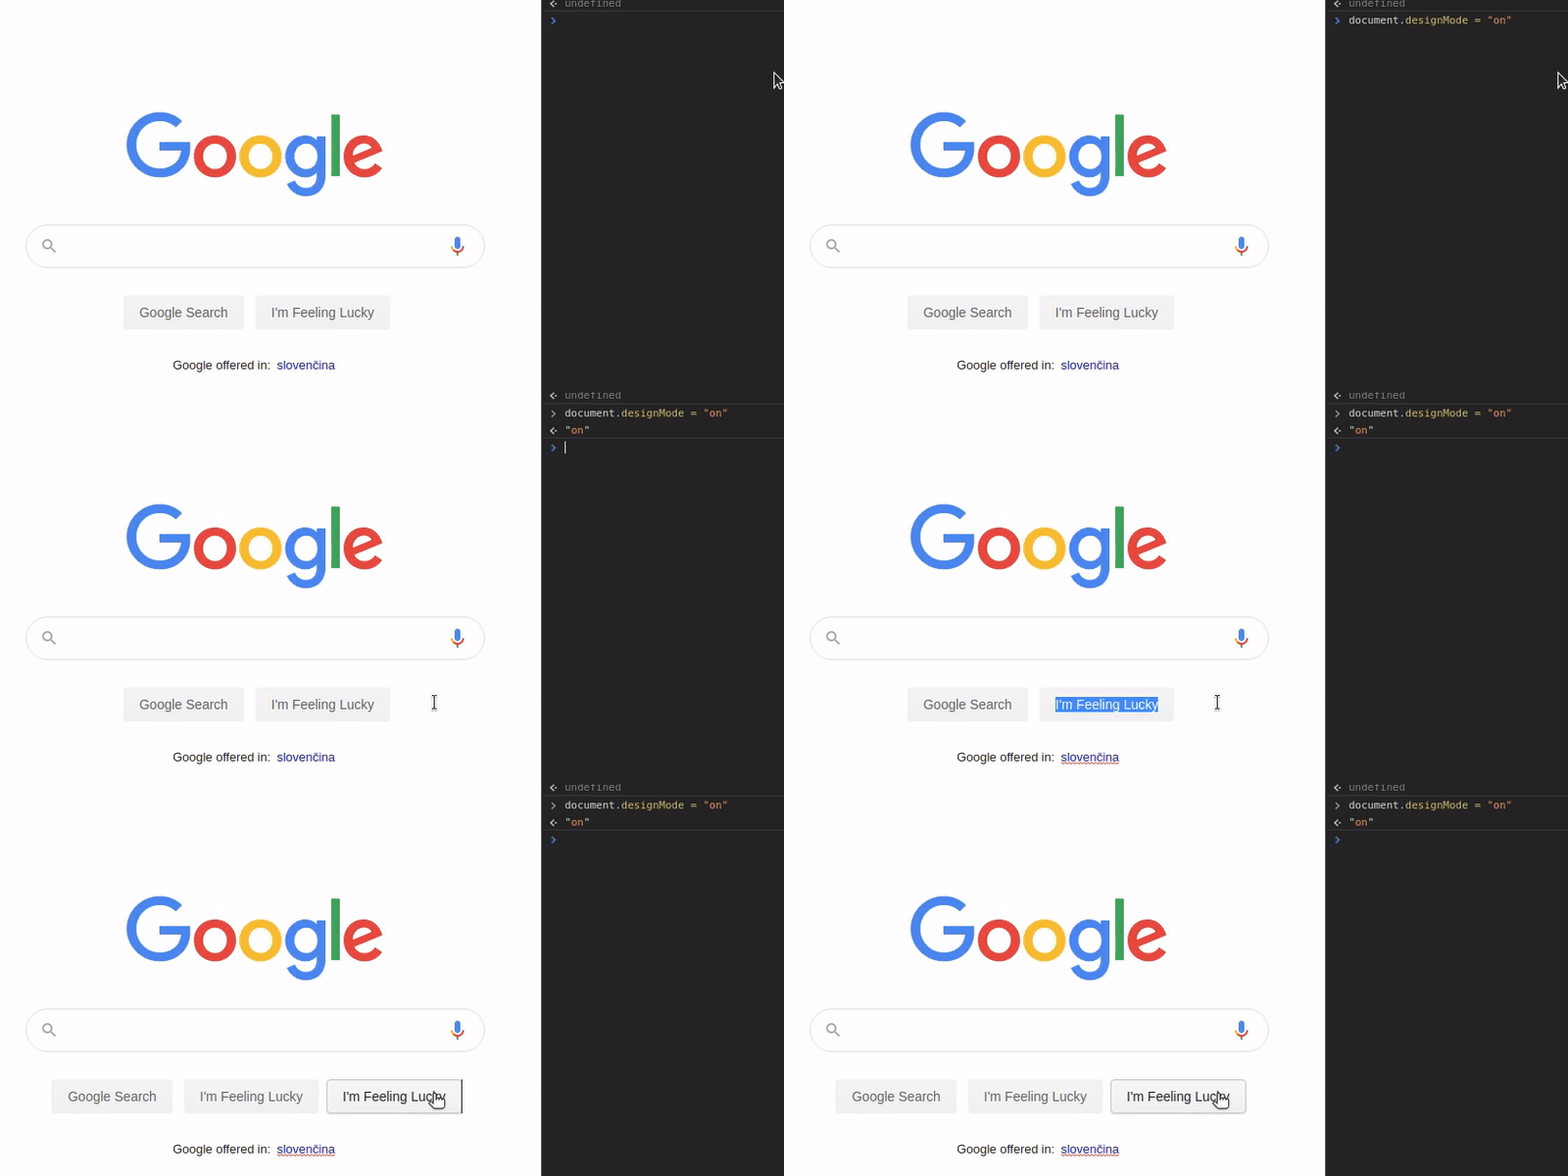
Another CSS/Design trick is to use Design Mode to directly edit anything on the website. No need to modify HTML and CSS source files - just click/highlight anything on the page and change it! To turn this mode on just type document.designMode = "on" into console and start designing (well, really just messing with anything and everything):
Conditional Breakpoints
It's generally quite hard/annoying to properly debug JavaScript running in browser using IDE. So, instead of using IDE, let's leverage DevTools debugger.
Setting basic breakpoints in debugger isn't really interesting and you surely know how to do that. What about conditional breakpoints, though? Sometimes you might have a for loop which iterates over 1000 or more records and you know that bug surfaces only when certain condition is met - e.g. when if statement inside said loop returns false. To stop at the breakpoint only when this conditions is met, we can set up conditional breakpoint:
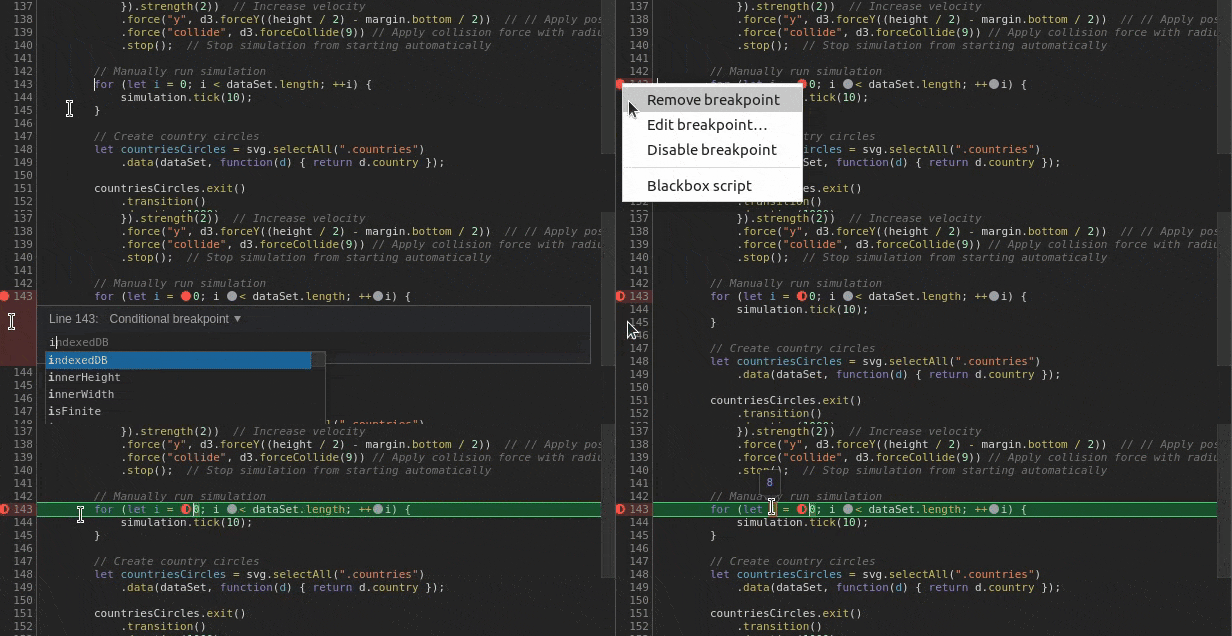
We first right-click on existing breakpoint (red dot), then click on Edit Breakpoint and insert our desired expression. When this expression evaluates to true the breakpoint will be triggered and we will have the chance to poke around. This conditional breakpoint doesn't have to be added only on lines with if statements - it can be on any line and its expression will be evaluated every time code execution passes through it.
While you are poking around, looking for the bug during paused execution, you might also consider adding suspecting variables to Watch tab, so that you can keep an eye on them as the values change. To add variable to Watch you can do the following:

Simulating Slow Internet
Most people know about the Network tab in DevTools in which you can see how long each function, operation or file load takes. What most people don't know though, is that you can also use Network tab to simulate slow internet connection using Network Throttling. Here's how to do that:

After adding and selecting this profile, all that's left to do is refresh the page and see how it performs with terrible internet connection. Beware - by trying this - you might just realise how slow your website really is (kinda depressive personal experience).
Measuring Website Performance
While on the topic of performance, let's explore what Chrome DevTools can do for us in terms of application profiling. To run profiler we need to switch to Performance tab in DevTools. When on this tab we just have to hit CTRL + Shift + E. This shortcut with start profiler and simultaneously refresh the page. After the page loads, we need to press this same shortcut again to stop profiler recording.

From here we can dig into network performance, animations, function times, etc. There's a lot of things you could have a look at, but one in particular would be to check function timing. To check some of those functions, you can click on the orange bars in the diagram and select Bottom-Up tab in the bottom section. If you then sort them by Total Time you might be able to find some parts of your code that are taking little too much time to complete.
Conclusion
These are just a few of my favourite tips and tricks and this definitely isn't exhaustive list of all the features in Chrome DevTools. You might find lots of useful features in Chrome DevTools Guides that fit your workflow. Also, I suggest to keep and eye on the What's new section for the latest updates, which bring more useful tools to your browser.
If you're missing any specific features it's worth checking DevTools extensions on Chrome Webstore as there are extra tools built by both Google and user community. And if you can't find tool/extension for your specific problem, maybe consider building something yourself using Extending DevTools tutorial. 😉